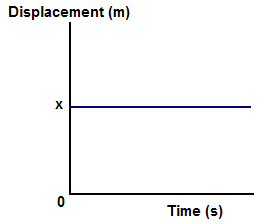
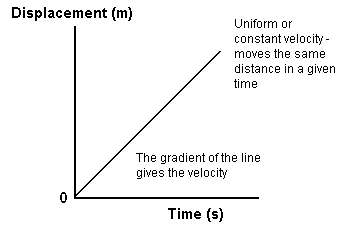
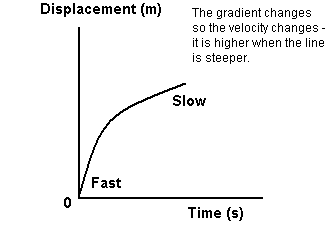
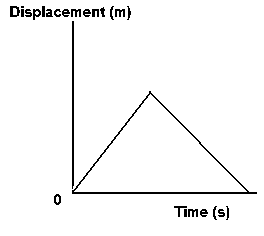
Displacement - Time Graphs Displacement - time graphs represent how the 'position of an object relative to a fixed point' (represented by the origin) changes as time progresses. Time (as always!) is on the x-axis and displacement on the y-axis. At GCSE level all movement is in a straight line as far as these graphs go and so displacement is the distance moved from the fixed point. You may be given data and asked to plot a graph or you may be asked to interpret of sketch one. You should be able to do all of these things. Rather than 'learn' these graphs you should aim to understand them. Talk yourself through what the line represents in terms of 'the object starts off 'so many metres' from the fixed point at t=0 seconds and then moves 'so far' in the next second....' etc. The graph represents the position as time progresses and tells you what it is doing. The gradient of the line represents the velocity. You need to know how to work out a gradient (See plot a graph) and show how you have done it. Do NOT just write down an answer. The area under the graph has no significance to you.
LOJ March 2003 |
Follow me...
|


