GCSE Questions: Energy Sources
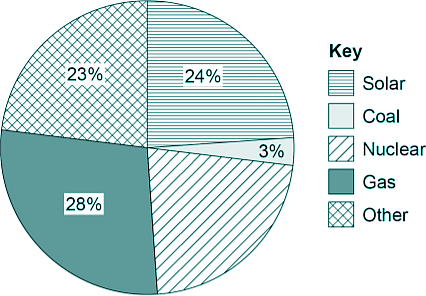
Q17. (a) The pie-chart shows how different energy resources were used in the box United Kingdom (UK) to generate electricity on one day in June 2018.
(i) The UK government plans to stop using coal-fired power stations by 2025.
Explain one environmental problem caused when electricity is generated by burning coal.
Carbon dioxide  is released into the atmosphere causing global warming.
OR
Particulates are released into the atmosphere causing global dimming and health problems.
OR
Sulphur dioxide is released into the atmosphere causing acid rain.
[2 marks]
(ii) Give two renewable energy resources that could make up the 'other' energy resources in the pie-chart.
Any two from:
 wind
wind
tidal
wave
hydroelectric power or pumped storage

geothermal
biofuel or biomass
[2 marks]
(c) Use the data from the pie-chart to determine the percentage of electricity generated in nuclear power stations that day.
28% + 23% + 24% + 3% = 78%
So the percentage for nuclear = 100% - 78% = 22%
[2 marks]
(b) The graph below shows how the demand for electricity varied with the time on that day.

(i) What was the difference between the maximum demand and minimum demand for electricity during this day?
See the graph
37,500 MW - 25,000 MW = 12,500 MW
[2 marks]
(ii) The graph shows that the demand for electricity increased between 06:00 and 09:00 Solar power could have met the demand if there were enough solar panels installed in the UK. Explain why.
Solar panels generate electricity from light energy. Therefore power output would increase throughout the morning (between 06:00 and 09:00) because as the Sun rises higher in the sky its rays become increasingly intense.
[2 marks]
(Total 10 marks)