GCSE Standard Questions: Electric Circuits
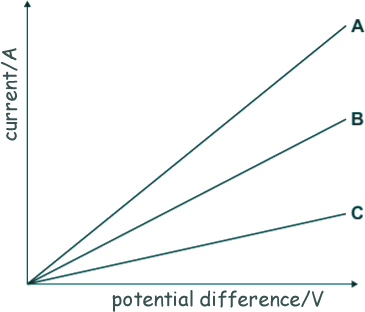
Q5. The sketch-graph below shows the current–potential difference graph for three wires, A, B and C.
(a)
(i) From the graph, how can you tell that the temperature of each wire is constant?
[1 mark]
(ii) Which one of the wires, A, B or C, has the greatest resistance? Explain your choice.
[2 marks]
(b) Ragnar measured the resistance of four wires. The table below shows the resistance of, and other data about, each of the four wires, J, K, L and M.
Wire |
Metal type |
Length/cm |
Diameter/mm |
Resistance/.... |
J |
copper |
50 |
0.17 |
0.36 |
K |
copper |
50 |
0.30 |
0.12 |
L |
copper |
100 |
0.30 |
0.24 |
M |
constantan |
100 |
0.30 |
7.00 |
[1 mark]
(i) The last column of the table should include the unit of resistance. What is the name and symbol of the unit of resistance?
[2 marks]
(ii) The resistance of a wire depends on many factors. Look at the table.
Which two wires from J, K, L and M show that the resistance of a wire depends on the length of the wire? Give a reason for your answer.
[2 marks]
(iii) Floki looked at the data in the table and wrote this conclusion:
'The resistance of a wire depends on the type of metal from which the wire is made.'
Floki could not be certain that his conclusion is true for all types of metal. Suggest what extra data is needed for him to be more certain that the conclusion is correct.
[1 mark]
(c) The resistance of a wire can be calculated using the readings from an ammeter and a voltmeter.
(i) Complete the circuit diagram below by drawing a voltmeter in the correct position in the circuit.
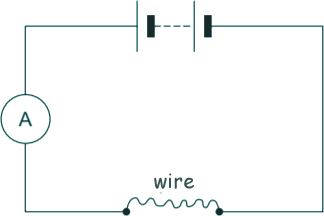
[1 mark]
(ii) In a circuit diagram, a wire can be represented by the symbol for a resistor.
Draw the circuit symbol for a resistor.
[1 mark]
(Total 10 marks)