
 |
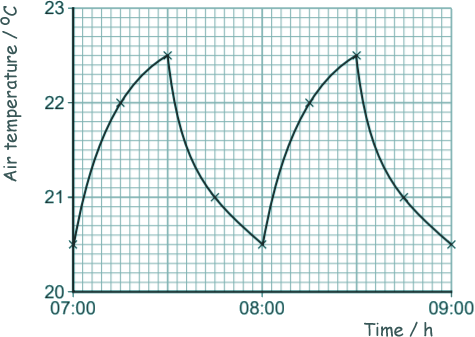
Heat Questions - GCSE Level Q15. A householder monitored how the air temperature inside his house changed over a two hour period. The householder measured the temperature every 15 minutes. The graph shows how the temperature changed with time.
(a)
[1 mark]
[1 mark] (b) The householder's heating is controlled by a thermostat. The thermostat switches the heating on when the temperature decreases below a certain temperature.
[1 mark]
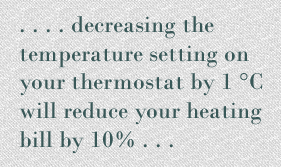
[1 mark] (c) The householder read the following extract from a newspaper article about reducing energy use in the home:
On Monday, the householder set his thermostat at 20.0 °C and recorded the energy, in kWh, used to heat his house. On Tuesday, the householder set his thermostat at 19.0 °C and recorded the energy, in kWh, used to heat his house. The table below shows the results of the householder's investigation:
[1 mark]
[2 marks]
[2 marks] (9 marks total)
|
Follow me...
|


Cyberphysics - a web-based teaching aid - for students of physics, their teachers and parents....