
 |
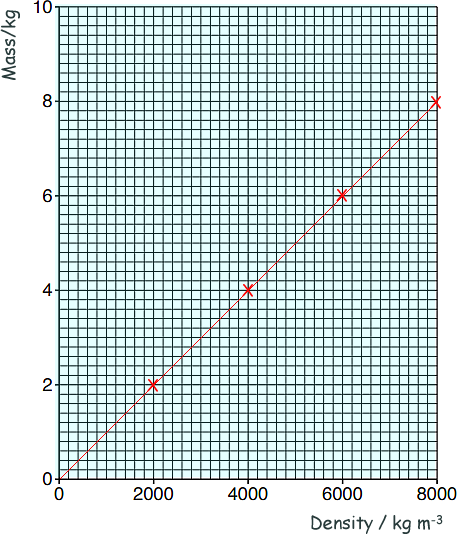
Materials: Density Q3. A student has data on four blocks of different materials. Each block has the same volume.
(a) Plot this data onto the graph paper below and draw a line of best fit.
[2 marks] (b) Describe the pattern shown on the graph. As the mass increases the density increases [2 marks] [Total: 4 marks] |
Follow me...
|


Cyberphysics - a web-based teaching aid - for students of physics, their teachers and parents....