Nuclear Fusion
Q2.
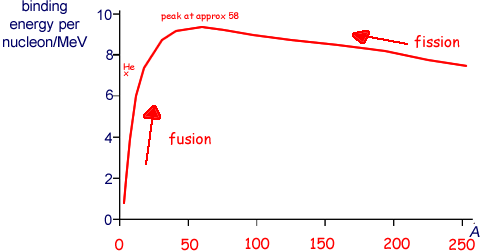
graph to show:
steep rise, maximum and gradual fall, with maximum between 6 MeV and 10 MeV 
suitable values of A (up to 200 - 250)
maximum shown at A between 50 and 60, with fall < 20% of rise
(a) Copy the axes above, and sketch a graph to show how the average binding energy per nucleon depends on the nucleon number, A, for the naturally occurring nuclides. Show appropriate values for A on the horizontal axis of the graph.
(3 marks)
(b)
(i) Briefly explain what is meant by nuclear fission and by nuclear fusion.
Fission occurs when a large nucleus splits into two nuclei and fusion ocurs when two small nuclei join (fuse) to form one nucleus
(ii) Describe how the graph in part (a) indicates that large amounts of energy are available from both the fission and the fusion processes.
Energy is released when the binding energy per nucleon increases as this results in greater stability Nuclear reactions occur when the reactants have lower binding energy per nucleon than the products. If you look at the graph you can see that this can happen in two ways: if nucei with very small values of A join together (fusion) they prduce nuclei with larger values of A that have greater binding energy per nucleon,or large nuclei can split to form smaller nuclei (fission) that are higher up on the graph line (see arrows). Binding energy per nucleon increases by movement towards peak of graph
(3 MAX marks)
(Total 6 marks)