
 |
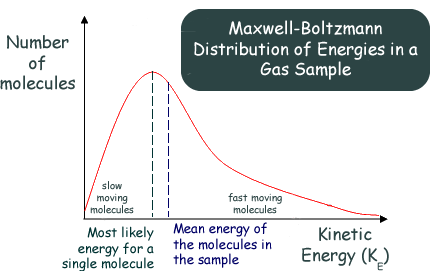
The Maxwell-Boltzmann Distribution Graphs A description of the statistical distribution of the energies of the molecules of a 'classical' gas was first proposed by the Scottish physicist James Clerk Maxwell in 1859. On the basis of probabilistic arguments the law gave the distribution of velocities among the molecules of a gas at a particular temperature. Maxwell's finding was further worked upon by a German physicist, Ludwig Boltzmann, and in 1871 he extended the findings to express the distribution of energies among the molecules. A Maxwell Boltzmann graph displays the number of molecules in a gas with a range of kinetic energies at a particular temperatureAt a given temperature:
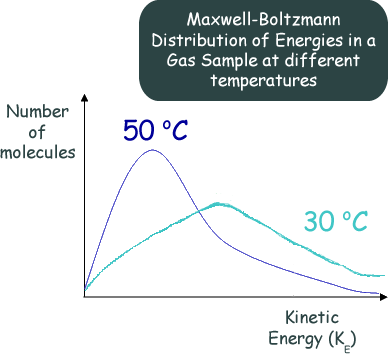
Effect of Increasing the Temperature
|
Follow me...
|


Cyberphysics - a web-based teaching aid - for students of physics, their teachers and parents....